
Screens
Configure Project
Advanced Config
Data Split
SFAM Train
SFAM Browse
Confusion Matirx
BackProp Train
BackProp Browse
Scatter Graph
Time Series Graph
BackProp Time Series Graph
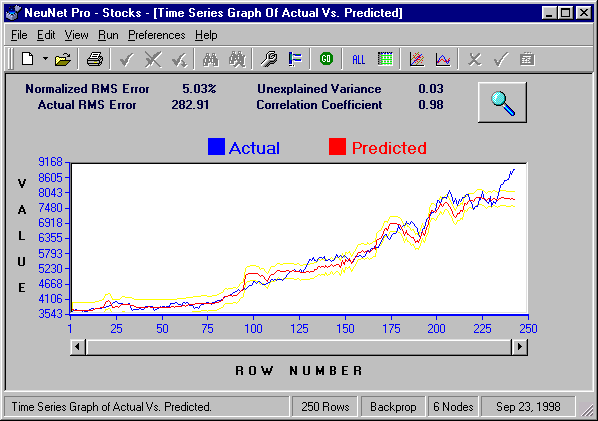
This screen provides both a numeric and graphical report showing the accuracy of your BackProp predictions for every row in your testing set.
Normalized RMS Error:
- This error indicates the Root Mean Square (RMS) error for the entire testing set.
- This error is also called "Standard Error of Estimate".
- The error is calculated as SquareRoot{SumOfAll[(Actual-Predicted)2] / NumberOfPredictions}
- This calculation is performed using normalized values, so it may be stated as percent.
- Approximately 2/3 of your predictions should lie within ± this percent of the actual target value.
Actual RMS Error:
- This error indicates the Root Mean Square (RMS) error for the entire testing set.
- This error is also called "Standard Error of Estimate".
- The error is calculated as SquareRoot{SumOfAll[(Actual-Predicted) 2] / NumberOfPredictions}
- This calculation is performed using denormalized values, so it is stated in the same units as the prediction field.
- Approximately 2/3 of your predictions should lie within ± these units from the actual target value.
Unexplained Variance:
- This number indicates what portion of the target value is not explained by the prediction value.
- Unexplained Variance = Actual_Rms_Error 2 / Variance_Of_Target_Column
Correlation Coefficient:
- This is a number between zero and one which indicates how well the prediction is correlated to the actual.
- A value of one indicates perfect predictions.
- A value of zero indicates no relationship between prediction and target.
- Correlation Coefficient = SquareRoot(1 - Unexplained Variance)
Time Series Graph:
- This is a visual representation showing the accuracy of all predictions for every row in your testing set.
- The band shown by faint yellow lines indicates a certainty band, as defined by the RMS Error. Approximately 2/3 of your testing set should lie within this certainty band.
- The example Time Series Graph shown above had the testing set at rows 1 to 250, and the training set was 1 to 200. Thus the graph to right of 200 shows true predictions that were not seen during training.
- This graph can be used with any BackProp project, but it is most useful when your data is an ordered series (eg. Time Series). Time series data should be ordered so the newest data occurs at the bottom of the table.
Zoom Graph:
- Left-click this zoom button to zoom inward for a closer view af the graph.
- Every left-click zooms in closer and every right-click zooms out further.
- There are 7 levels of zoom. Zooming above level 7 will "wrap around" to level 1.
Likewise, zooming below level 1 wraps aroung to level 7.
Hint: The width of the scrollbar handle reflects the current level of zoom.