Screens
Configure Project
Advanced Config
Data Split
SFAM Train
SFAM Browse
Confusion Matirx
BackProp Train
BackProp Browse
Scatter Graph
Time Series Graph
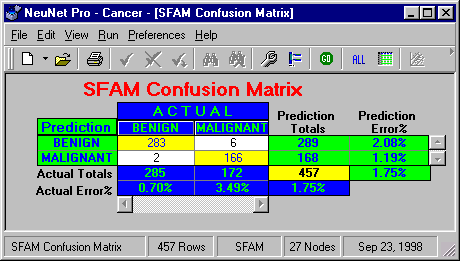
SFAM Confusion Matrix

When there are many classes, it shows which classes are difficult to differentiate from certain other classes.
Double click on any cell to browse the data contributing to that cell.
Reading the SFAM Confusion Matrix takes some practice but it is not difficult.
For example, the above confusion matrix is telling you that:
- Your test set contained 285 actual benign cases and 172 actual malignant cases for a total of 457 cases.
- You predicted 289 benign and 168 malignant for a total of 457 predictions.
- Of the 285 actual benign, 283 were correctly predicted and 2 were predicted as malignant.
- Of the 172 actual malignant, 166 were correctly predicted and 6 were predicted as benign.
- Of the 289 predicted benign, 283 were actually benign and 6 were actually malignant.
- Of the 168 predicted malignant, 2 were actually benign and 166 were actually malignant.
- 2.08% of the benign predictions were wrong.
- 0.70% of the actual benign cases were incorrectly predicted.
- 1.19% of the malignant predictions were wrong.
- 3.49% of the actual malignant cases were incorrectly predicted.