Screens
Field Selection
Row Selection
Rule Extraction
Browse All
Browse Test
Confusion Matrix
Live Predictions
Field Statistics
Class Details
Tree Chart
Flow Chart
Browse Filter
Serial Number

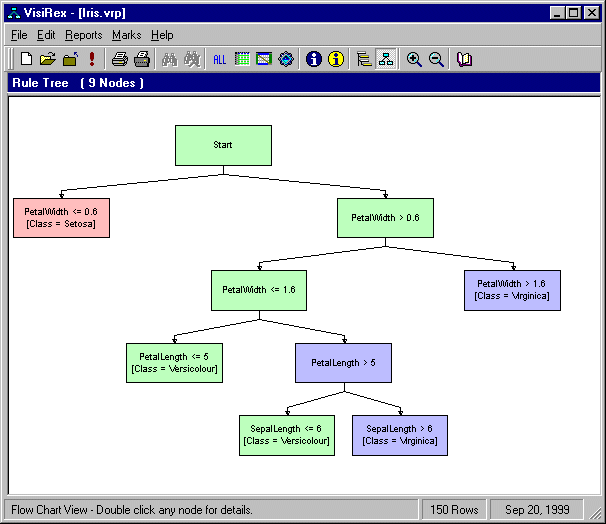
Flow Chart View shows your extracted rules as a color-coded flow chart
Flow Chart... Features
- This view works best for smaller trees having less than 200 to 300 nodes.
- This view is not available if your tree becomes too wide.
- Double click on any node of the flow chart and you will be delivered to a data browse showing all data passing through that node.
- Use the magnifying glass Zoom In or Zoom Out to zoom in or out on the flow chart.
- Drag a rectangle around a certain area of the flow chart and the view will automatically zoom in to that area. HINT: This drag method is better than using the magnifying glass.
- Use the Chart Control to color the flow chart according to data quantity, prediction confidence, or predicted class.
- Place your mouse cursor over a particular node to view the Local report for this node in the Chart Control.