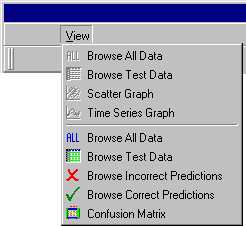
Menu Items
File
Edit
View
Run
Preferences
Help
View Menu
Select a menu item

View... Browse All Data
- This feature is used to browse a table showing all the data in the current data table.
- Right click on the blue column header to Sort and Find by column.
View... Browse Test Data
- This feature is used to browse a table showing all data in the current test set.
- The NeuNet prediction column is shown beside the target prediction column.
- With SFAM, the incorrect predictions are show in red.
- With BackProp, a "Difference" column shows the accuracy of every prediction.
- Right click on the blue column header to Sort and Find by column.
View... Scatter Graph
- This graph is available only for BackProp projects.
- The Scatter Graph gives a visual presentation showing the accuracy of all predictions.
- The entire test set is graphed with actual versus predicted.
- The most accurate predictions are nearest to the blue diagonal line.
View... Time Series Graph
- This graph is available only for BackProp projects.
- The Time Series Graph shows actual and predicted values by row number.
- This graph is most useful for time series data.
- For best results, time series data should be structured so the newest data is at the bottom of the table.
View... Browse Incorrect Predictions
- This view is available only for SFAM projects.
- Browse a table showing only the incorrect predictions within the current test set.
- Right click on the blue column header to Sort and Find by column.
View... Browse Correct Predictions
- This view is available only for SFAM classification projects.
- Browse a table showing only the correct predictions within the current test set.
- Right click on the blue column header to Sort and Find by column.
View... Confusion Matrix
- This feature is available only for SFAM classification projects.
- Browse a table showing actual class versus predicted class for current test set.
- All correct predictions lie on the yellow diagonal cells.